Trending

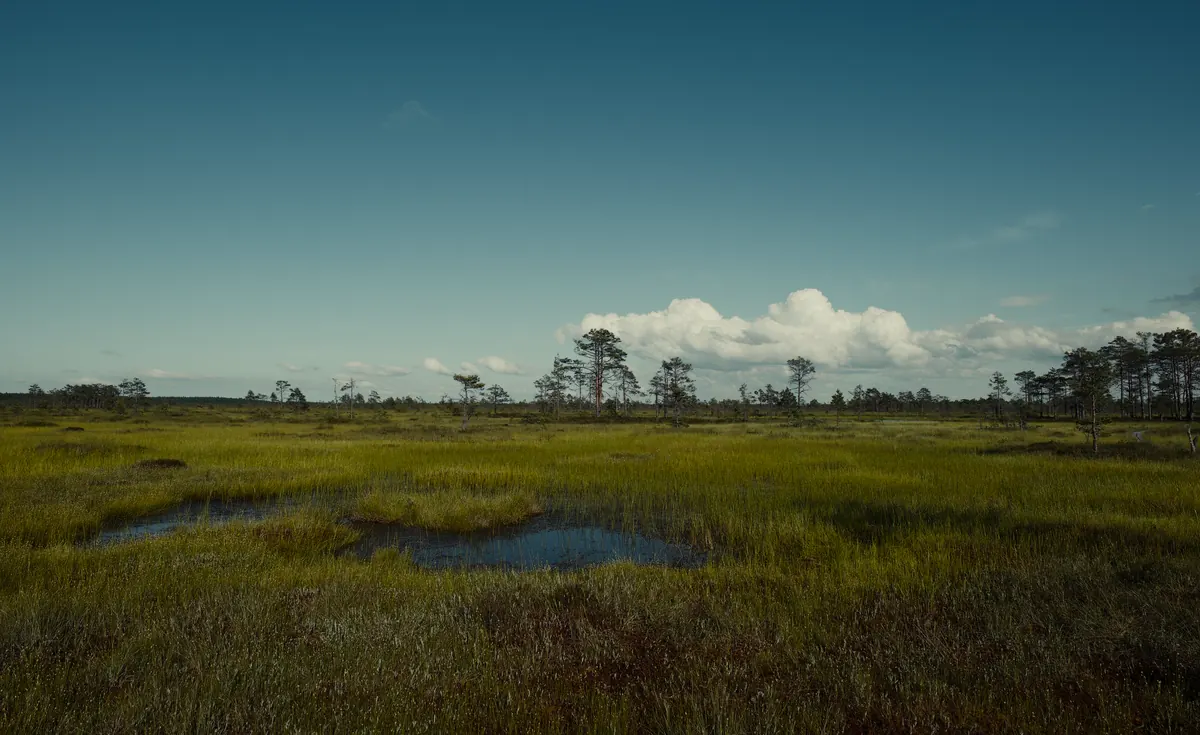
Ten minutes in a wetland tells you more than an afternoon with a spreadsheet, provided you know what to look at. A rapid health assessment is not a shortcut around proper survey work. It is a way of reading the obvious signals first, so that any sampling you do later is aimed at the right questions. With a notebook, a probing rod and boots that can take water, you can form a defensible first impression and leave with something worth returning to.
The protocol below is designed for a single visit of one to three hours. It works on fens, bogs, wet meadows, reedbed and marsh. It will not tell you everything, and it is not a substitute for statutory condition assessment on a designated site. What it will do is give you a structured, repeatable snapshot you can compare against next year's.
Most wasted field days are wasted before anyone gets out of the vehicle. Check access and permission, and if the site is designated, check whether you need consent before you do anything that disturbs soil or vegetation. Clean your kit between sites: wetland biosecurity matters, and mud carries more than you think.
Take the following:
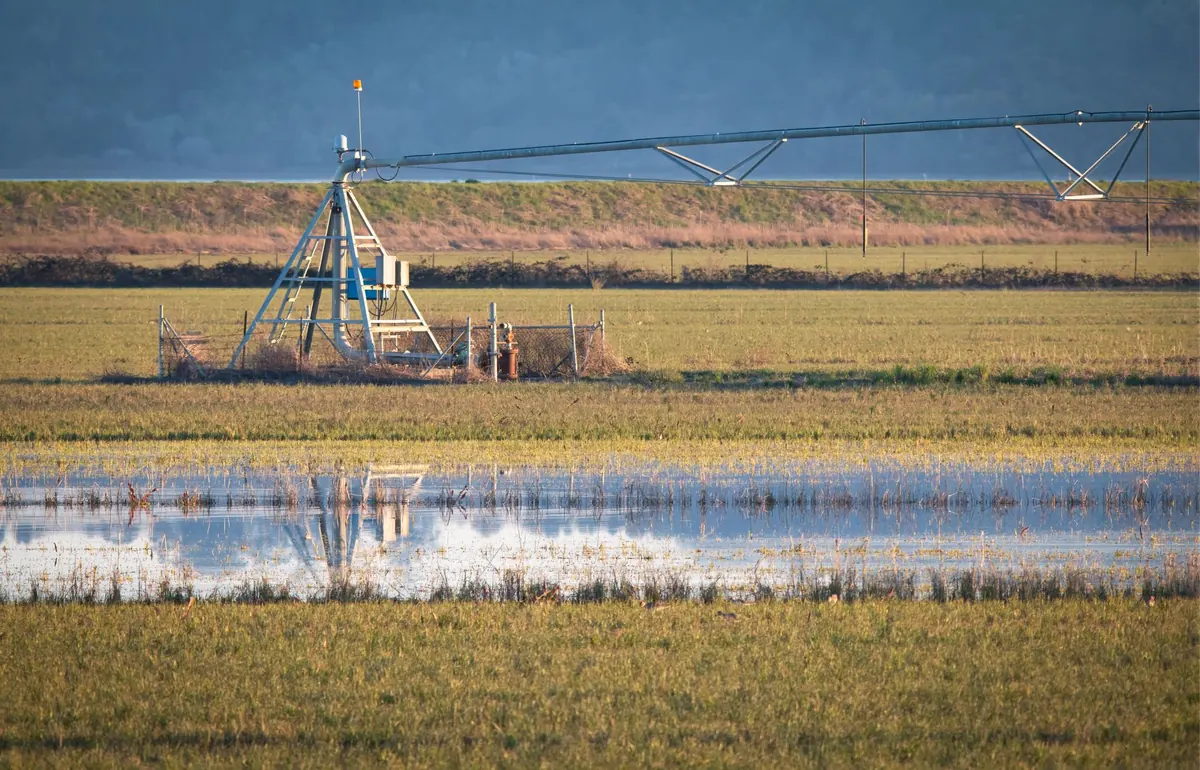
Water is the first question, and the answer is usually visible from the edge. Look for standing water, saturated ground that glistens when you press a boot into it, and watermarks on stems and fence posts. Sphagnum with a pale, dried top and dark, wet base tells you the water table has dropped recently. Iron staining in a channel or a flush of filamentous algae suggests that water is moving, but carrying a nutrient load.
Then work out where water enters and leaves. Note ditches, grips, culverts and straightened channels, and whether they are blocked, recently cleaned, or actively flowing. A single straight drain cut through a fen can lower the water table across a wide area, and the effect on vegetation may be visible as a band of coarser, drier species either side of it.
Record the conditions on the day: date, time, recent rainfall, and whether you are in a wet or dry spell. A parched visit in a dry August is not evidence of a dry wetland. If you can, note the depth to water in a hand-augered hole and leave it to settle before reading.
Vegetation integrates everything else. It responds to water level, water chemistry, grazing and nutrient input, and it does so over seasons rather than hours, which makes it a stable indicator.
Walk a rough transect across the main zones and stop where the community changes. At each stop, list the species you can identify and estimate cover for the three or four dominants. You do not need a complete flora; you need the species that tell you something.
Note grazing and cutting too. Tussocky, lightly grazed swards and tidy, uniformly short ones mean quite different things for invertebrates and breeding birds.
Push the rod in until it stops and record the depth. Deep, soft peat with a springy feel is a good sign; a rod that hits gravel at 15 cm in what should be a peatland tells a different story.
Then cut a small spade pit, no more than 30 cm deep, and look at it properly. Peat should be dark, fibrous and recognisably made of plant remains. A crumbly, earthy loam with worm burrows and root channels indicates that the top layer is aerated and oxidising — often the legacy of drainage or repeated disturbance.
Colour and smell carry most of the information:
Also check compaction. If a penknife or tile probe struggles to enter the surface, livestock or machinery has been working the ground wet.
A rapid assessment becomes far more useful if you can put a number on it. Keep it simple and consistent: score each of the three domains from 0 to 3, where 0 is unfavourable, 1 is poor, 2 is moderate and 3 is good. Add them for a total out of nine.
Then convert the total: 8–9 good, 5–7 moderate, 0–4 poor. The bands are yours to set. What matters is that you apply the same scheme, at the same season, in the same way, for every visit — otherwise the comparison means nothing.
Seasonality is the big one. A fen in April and the same fen in September can look like two different places, both legitimately. Fix your survey window and stick to it.
Observer drift is the second. Two people scoring the same quadrat can differ by a full point unless they calibrate first. Walk the first few stops together, agree your definitions, then split up.
Third, do not let the edge dominate. Gateways, tracks and field margins are almost always more disturbed than the core. Push at least twenty metres in before you start recording condition properly, and note edge effects separately.
Finally, resist the temptation to explain everything. A single visit can record what is there; it rarely establishes why.
Do the write-up the same day, while you can still remember which tussock was which. Type up your species lists and scores, label the photographs with grid references, and sketch a rough map showing your transect, the zones you identified and any drains or inflows.
Keep the raw sheets. Store the digital record with the site file, along with the date, the observers and the weather. Then set a revisit interval — annual is usually enough for a rapid assessment — and leave permanent markers or a recorded GPS point so the next visit starts from the same place.
If the site is designated, or if your findings might lead to a decision about drainage, grazing, tree planting or restoration works, pass the results to the relevant statutory body and take professional ecological advice before anything is changed on the ground. A rapid assessment is a starting point, not a verdict. Used well, it is the cheapest way to know whether a wetland is holding its own or quietly slipping away — and whether anyone needs to act.
Photo: balouriarajesh / Pixabay